S&P 500 RMB Index Fund
Product Summary
Quick Look:
Invest in the Standard and Poor’s 500 Index without the hassle of sending money abroad, converting currencies, or lock-in periods. The index tracks the stock performance of 500 of the largest companies listed on stock exchanges in the United States. For more information on the S&P 500 Index: Wikipedia, Investopedia.
From the Fund Manager:
The Fund’s target is to closely track the underlying index, the S&P 500, and consistently pursue the minimization of tracking errors. Furthermore, the fund strives to obtain market returns represented by the underlying index by investing in target ETFs and individual securities.
View full prospectus (in Chinese)
Fund Facts
| Fund Type | |
|---|---|
| Risk Level* | Moderate to agressive |
| Minimum Investment | ¥1000 |
| Open Date | 2018-6-7 |
| Fund Custodian | Industrial and Commercial Bank of China (ICBC) |
| Fund Advisor | Bosera Fund Management Co., Ltd. |
| Annual Expense Ratio** | 0.85% |
| Total Assets Invested | ¥822,000,000 |
** Expense ratio amounts are already included in the return and daily value figures listed. More info on fees .
Performance
Scroll to view more info >>
| Time Period | Return, S&P 500 RMB Index Fund | Performance Rank in Category (?) |
|---|---|---|
| 2023 | 23.92% | Top 25% |
| 2022 | -12.20% | Top 30% |
| 2021 | 22.39% | Top 25% |
| 2020 | 8.68% | Top 50% |
| 2019 | 29.37% | Top 25% |
| Annual Average | 14.43% | |
| Open Date | 2018/6/7 |
Returns Comparison
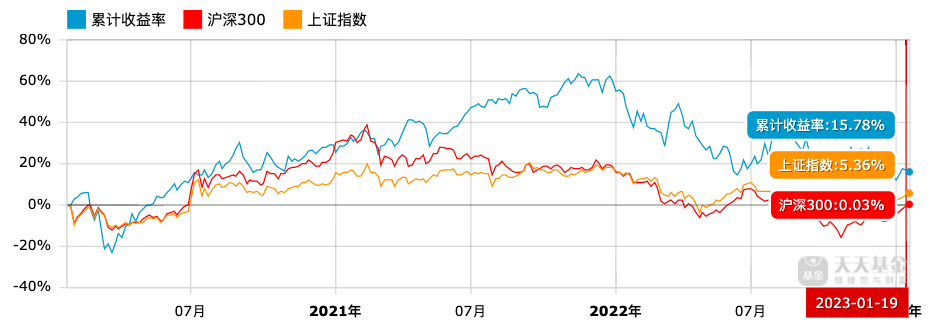
This chart illustrates the fund performance in comparison to the general Chinese markets over the 3 years spanning 2020/1/19-2023/1/19. The NASDAQ 100 RMB fund is in blue, the CSI 300 Index in red, and the Shanghai & Shenzhen Composite in orange.
Over this timeframe, the NASDAQ 100 RMB fund outperformed the CSI 300 Index by 15.75% and the Shanghai & Shenzhen Composite by 10.42%.
Top 10 Holdings
| Stock Name |
|---|
| Apple Inc (AAPL) |
| Microsoft Corp (MSFT) |
| Amazon.com Inc (AMZN) |
| Nvidia Corp (NVDA) |
| Alphabet (GOOGL shares) |
| Meta Platforms Inc (META) |
| Alphabet (GOOG shares) |
| Berkshire Hathaway Inc (BRK/B) |
| Tesla Inc (TSLA) |
| UnitedHealth Group Inc (UNH) |
| 10 Largest Holdings: 30.94% of total fund assets |
Hypothetical Portfolio Growth
Returns Comparison
This chart illustrates the fund performance in comparison to the general Chinese markets over the last 3 years (2020/1/19-2023/1/19). The NASDAQ 100 RMB fund is in blue, the CSI 300 Index in red, and the Shanghai & Shenzhen Composite in orange.
Over this timeframe, the NASDAQ 100 RMB fund outperformed the CSI 300 Index by 15.75% and the Shanghai & Shenzhen Composite by 10.42%.


