New Income Stock & Bond Mix
Product Summary
Quick Look:
A Hybrid fund invests in a combination of both stocks and bonds, while still trying to maximize growth. This blend makes for solid middle ground as its expected risk and expected return are lower than stock funds but higher than bond funds.
From the Fund Manager:
The Fund determines the allocation ratio of asset classes such as stocks and bonds in the portfolio. In asset allocation, the Fund mainly considers (1) Macroeconomic trends, mainly through the analysis of macroeconomic indicators such as GDP growth, industrial added value, price levels, and market interest rates, to judge the real economy in the economic cycle. (2) Market valuation and liquidity, closely tracking changes in the overall valuation of the domestic and foreign markets, changes in the growth rate of money supply and its possible impact on the overall supply and demand of funds in the market; (3) Policy factors, paying close attention to the country’s macroeconomics and relevant policies at the economic and industrial economic levels and the impact of their changes on the market and related industries.
View full prospectus (in Chinese)
Fund Facts
** Expense ratio amounts are already included in the return and daily value figures listed. More info on fees.
Performance
Scroll to view more info >>
| Time Period | Return, New Income Stock & Bond Mix Fund | Performance Rank in Category (?) | Return, CSI 300 Index benchmark (?) |
|---|---|---|---|
| 2024 | -0.55% | Bottom 50% | 14.68% |
| 2023 | -11.30% | Bottom 50% | -11.38% |
| 2022 | -19.81% | Bottom 50% | -21.63% |
| 2021 | 12.74% | Top 30% | -5.20% |
| 2020 | 82.83% | Top 10% | 27.21% |
| 2019 | 57.80% | Top 10% | 36.07% |
| 2018 | 2.67% | Top 10% | -25.31% |
| 2017 | 11.84% | Top 25% | 21.78% |
| 2016 | 2.41% | Top 20% | -11.28% |
| Annual Average | 15.40% | 2.77% | |
| Open Date | 2015/4/17 |
Returns Comparison
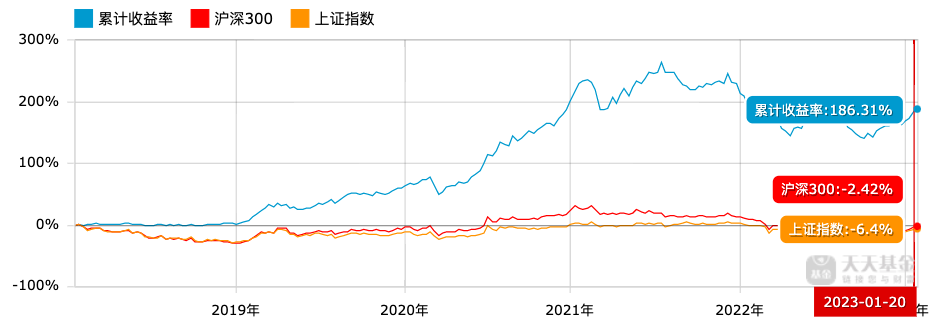
This chart illustrates the fund performance in comparison to the general Chinese markets over the 5 years spanning 2018/1/20-2023/1/20.
The New Income Stock & Bond Mix fund is in blue, the CSI 300 Index in red, and the Shanghai & Shenzhen Composite in orange.
Over this timeframe, the New Income Stock & Bond Mix fund outperformed the CSI 300 Index by 188.73% and the Shanghai & Shenzhen Composite by 192.71%.
Top 10 Holdings
Hypothetical Portfolio Growth
Returns Comparison
This chart illustrates the fund performance in comparison to the general Chinese markets over the 5 years spanning 2018/1/20-2023/1/20. The New Income Stock & Bond Mix fund is in blue, the CSI 300 Index in red, and the Shanghai & Shenzhen Composite in orange.
Over this timeframe, the New Income Stock & Bond Mix fund outperformed the CSI 300 Index by 188.73% and the Shanghai & Shenzhen Composite by 192.71%.


