Managed Debt Mix
Product Summary
Quick Look:
This fund invests in bonds issued by large and established banks and companies in China. This makeup keeps the fund in a lower-risk category with relatively stable results.
From the Fund Manager:
The fund invests in financial instruments with good liquidity, including treasury bonds, local government bonds, central bank bills, financial bonds, corporate bonds, corporate bonds, medium-term notes, short-term financing bonds, super short-term financing bonds, subordinated bonds, SME private placements Laws and regulations such as bonds, convertible bonds (including convertible bonds with separable transactions), exchangeable bonds, asset-backed securities, bond repurchases, bank deposits, inter-bank deposit certificates, or other financial instruments allowed by the China Securities Regulatory Commission to invest in funds. The fund does not directly invest in equity assets such as stocks and warrants, but it can hold stocks formed by the conversion of convertible bonds, warrants issued by holding the stocks, and warrants generated by investment separation trading convertible bonds, etc. Assets such as stocks and warrants held for the above reasons will be sold within 10 trading days from the day when the fund can be traded.
View full prospectus (in Chinese)
Fund Facts
** Expense ratio amounts are already included in the return and daily value figures listed. More info on fees.
Performance
Scroll to view more info >>
| Time Period | Return, Managed Debt Mix Fund | Performance Rank in Category (?) | Return, CSI 300 Index benchmark (?) |
|---|---|---|---|
| 2024 | 2.33% | Bottom 50% | 14.68% |
| 2023 | -1.88% | Bottom 50% | -11.38% |
| 2022 | 0.95% | Bottom 50% | -21.63% |
| 2021 | 6.91% | Top 5% | -5.20% |
| 2020 | 10.48% | Top 0.5% | 27.21% |
| 2019 | 5.43% | Top 20% | 36.07% |
| 2018 | 6.59% | Top 50% | -25.31% |
| Annual Average | 3.47% | 2.06% | |
| Open Date | 2017/2/22 |
Returns Comparison
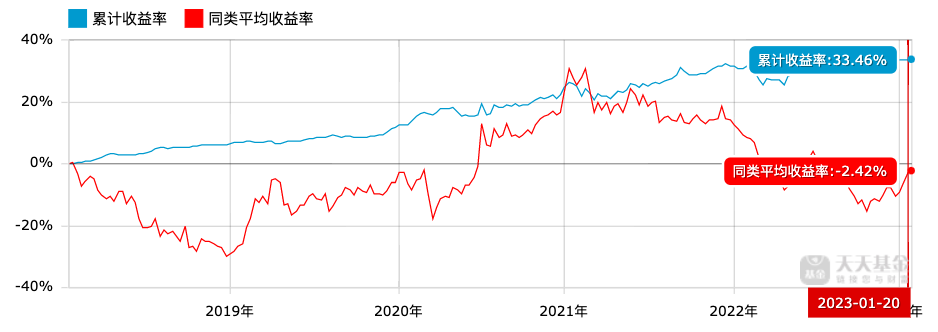
This chart illustrates the fund performance in comparison to the general Chinese markets over the 5 years spanning 2018/1/20-2023/1/20. The Managed Debt Mix fund is in blue & the CSI 300 Index is in red.
Over this timeframe the Managed Debt Mix fund outperformed the CSI 300 Index by 35.88%.
Top 10 Holdings
Hypothetical Portfolio Growth
Returns Comparison
This chart illustrates the fund performance in comparison to the general Chinese markets over the 5 years spanning 2018/1/20-2023/1/20. The Managed Debt Mix fund is in blue & the CSI 300 Index is in red.
Over this timeframe the Managed Debt Mix fund outperformed the CSI 300 Index by 35.88%.


