CSI 300 Index Enhanced
Product Summary
Quick Look:
The CSI 300 Index is designed to replicate the performance of the top 300 stocks traded on the Shanghai Stock Exchange and the Shenzhen Stock Exchange. It has been calculated since April 8, 2005. From the beginning of 2006 to the beginning of 2021, the index’s price grew from 923.45 to 5211.29, a 564% increase over the 15-year span.
It is considered to be a blue-chip index for Mainland China stock exchanges, is often seen as the Chinese counterpart to the S&P 500 Index in the United States, and is a main gauge of the overall Chinese stock markets.
From the Fund Manager:
The Fund is a stock index-enhanced fund. On the basis of striving to effectively track the CSI 300 Index, it conducts active index portfolio management and risk control through quantitative methods, strives to achieve investment returns that exceed performance benchmarks, and seeks to provide long-term value-added management of holdings.
The value of the daily deviation between the performance benchmark (CSI 300 Index) and the Fund should not exceed 0.5%. The annual deviation should not exceed 7.75%.
View full prospectus (in Chinese)
Fund Facts
** Expense ratio amounts are already included in the return and daily value figures listed. More info on fees.
Performance
Scroll to view more info >>
(this price is updated every business day)
Top 10 Holdings
| Stock Name | Stock name (Chinese) | Portion of net worth |
|---|---|---|
| Kwiechow Moutai | 贵州茅台 | 5.52% |
| CATL | 宁德时代 | 4.31% |
| Ping An Insurance | 中国平安 | 4.16% |
| China Merchant’s Bank | 招商银行 | 3.82% |
| Midea | 美的集团 | 2.84% |
| China Yangtze Power | 长江电力 | 2.68% |
| Zijin Mining Group | 紫金矿业 | 2.26% |
| BYD | 比亚迪 | 1.82% |
| Industrial Bank | 兴业银行 | 1.48% |
| Luxshare Precision | 立讯精密 | 1.44% |
| 10 Largest Holdings: 30.33% of total fund assets | ||
Hypothetical Portfolio Growth
Historical Performance
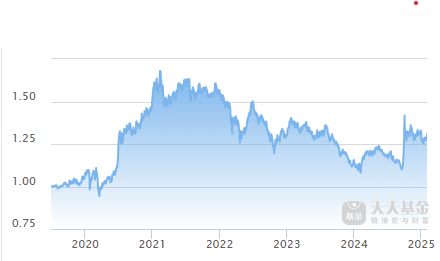
This chart illustrates the fund performance in since 2020.


