China Information Technology Industry
Product Summary
The fund is a hybrid fund that actively invests in the mainland Chinese Market. The target proportion of equity investment in the fund’s investment portfolio is 60%-95% of the fund’s assets, of bond investment is 0-35% of the fund’s assets, and of cash and other short-term financial instrument assets within one year of the total is not more than 5% of the fund’s net asset value.
The Fund adopts a top-down strategy and determines the allocation ratio of fund assets to stocks, derivatives, bonds and cash based on a comprehensive analysis of macroeconomic, policy and securities market trends. Adopting a bottom-up strategy, with value and growth as the main line, value-based stocks that are within a relatively safe margin and have good cash dividends according to the selection of Soochow ’s value motivation evaluation system The dynamic evaluation system selects high-growth, excellent company quality and good growth stocks as investment targets.
View full prospectus (in Chinese)
Fund Facts
** Expense ratio amounts are already included in the return and daily value figures listed. More info on fees.
Performance
Scroll to view more info >>
Returns Comparison
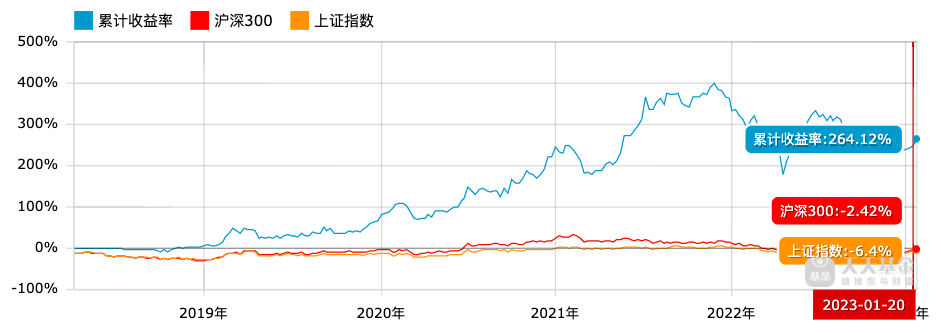
This chart illustrates the fund performance in comparison to the general Chinese markets from 2018/4/18-2023/1/20. The China IT Industry Fund is in blue, the CSI 300 Index in red, and the Shanghai & Shenzhen Composite in orange.
Over this timeframe the China IT Industry Fund outperformed the CSI 300 Index by 266.54% and the Shanghai & Shenzhen Composite by 270.52%.
Top 10 Holdings
Hypothetical Portfolio Growth
Returns Comparison
This chart illustrates the fund performance in comparison to the general Chinese markets from 2018/4/18-2023/1/20. The China IT Industry Fund is in blue, the CSI 300 Index in red, and the Shanghai & Shenzhen Composite in orange.
Over this timeframe the China IT Industry Fund outperformed the CSI 300 Index by 266.54% and the Shanghai & Shenzhen Composite by 270.52%.


